
Technical analysis is one of the most important skills every forex trader must learn. It helps traders understand market behavior, identify trading opportunities, and make informed decisions based on price movements rather than guesswork. Whether you are a beginner or an experienced trader, mastering technical analysis can significantly improve your trading results.
What is Technical Analysis?
Technical analysis is the study of past market data, primarily price and volume, to predict future price movements. Instead of focusing on economic news or financial reports, technical analysts concentrate on charts and patterns.
The core idea behind technical analysis is based on three key principles:
- Price reflects everything – All available information (news, events, market sentiment) is already included in the price.
- Price moves in trends – Markets tend to move in a direction (upward, downward, or sideways).
- History repeats itself – Patterns formed in the past are likely to occur again because human behavior in markets is consistent.
In simple terms, technical analysis helps traders answer the question:
👉 “What is the market likely to do next based on what it has done before?”
Reading Candlestick Charts
Candlestick charts are the most commonly used charts in forex trading. They provide a visual representation of price movements over a specific period.
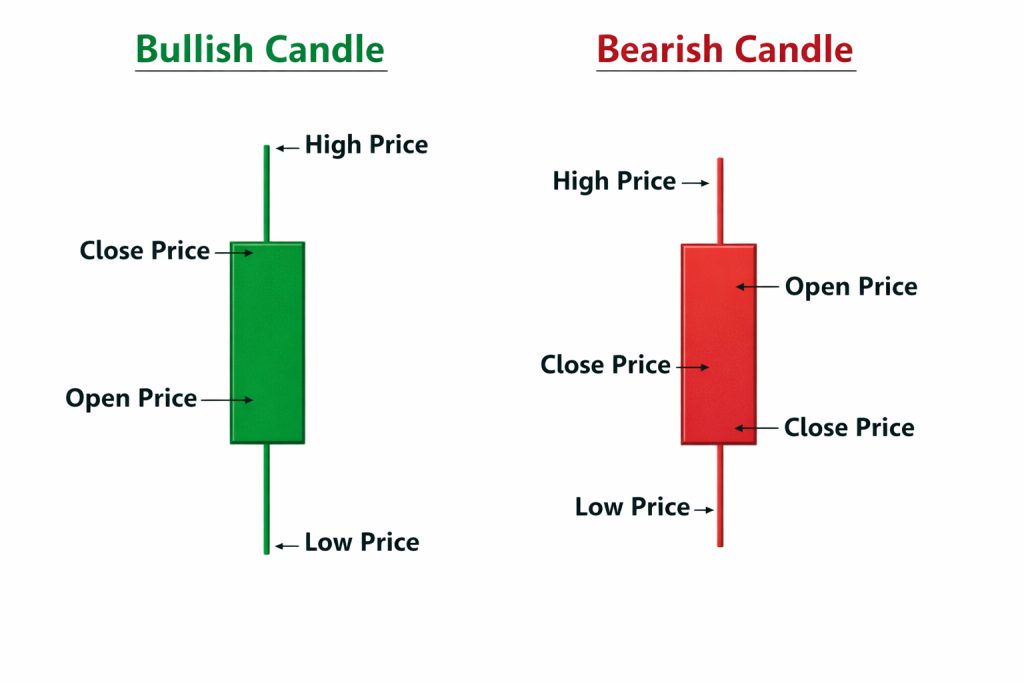
Each candlestick shows four key pieces of information:
- Open price – Where the price started
- Close price – Where the price ended
- High price – The highest point reached
- Low price – The lowest point reached
Types of Candlesticks
- Bullish candle (usually green): Price closed higher than it opened
- Bearish candle (usually red): Price closed lower than it opened
Why Candlesticks Matter
Candlesticks help traders:
- Understand market sentiment (buyers vs sellers)
- Identify patterns like Doji, Engulfing, and Hammer
- Spot potential reversals or continuations in the market
For example, a series of bullish candles shows strong buying pressure, while repeated bearish candles indicate selling pressure.
Support and Resistance
Support and resistance are key concepts in technical analysis that help traders identify important price levels.
Support
Support is a price level where the market tends to stop falling and may reverse upward. It acts like a “floor.”
Resistance
Resistance is a price level where the market tends to stop rising and may reverse downward. It acts like a “ceiling.”
Why They Are Important
Traders use support and resistance to:
- Identify entry and exit points
- Place stop-loss and take-profit levels
- Understand where price is likely to react
Example:
- If price repeatedly bounces from a level → that is support
- If price repeatedly fails to break above a level → that is resistance
Trend Identification
A trend is the general direction in which the market is moving. Identifying the trend is crucial because it helps traders align their trades with the market direction.
Types of Trends
- Uptrend (Bullish Market)
- Higher highs and higher lows
- Traders look for buying opportunities
- Downtrend (Bearish Market)
- Lower highs and lower lows
- Traders look for selling opportunities
- Sideways (Range Market)
- Price moves between support and resistance
- No clear direction
Popular Tools for Identifying Trends
- Trendlines
- Moving averages
- Market structure (highs and lows)
Key Rule:
👉 “The trend is your friend.”
Trading in the direction of the trend increases your chances of success.
Why Traders Analyze Price Charts
Price charts are the foundation of technical analysis. Traders analyze them to make better trading decisions.
Key Reasons:
- To identify trading opportunities
Charts help traders spot entry and exit points. - To understand market behavior
Charts show how buyers and sellers interact in real time. - To manage risk
By using support, resistance, and trends, traders can set stop-loss and take-profit levels. - To avoid emotional trading
Charts provide objective data, reducing guesswork and emotional decisions. - To improve consistency
Consistent analysis leads to more disciplined trading strategies.
Conclusion
Technical analysis is a powerful tool that allows forex traders to read the market and make informed decisions. By understanding candlestick charts, support and resistance levels, and market trends, traders can improve their ability to predict price movements.
As a beginner, focus on:
- Learning how to read charts
- Practicing trend identification
- Understanding key price levels
With time, practice, and consistency, technical analysis will become a natural part of your trading process and help you trade with confidence.